Mapping the Nation with Pre-1900 U.S. Maps: North vs South and Moving West
NYPL’s pre-1900 U.S. map collection tells the story of America: From its beginnings in the 17th century along the Atlantic coastline, to the consolidation of 13 British colonies in the late 18th century, and concluding with its absorption of French, Spanish, and Mexican territories expanding westward from the Mississippi River, to the Pacific Ocean and beyond by the conclusion of the 19th century. Below is the second part of our two-part series; read part one here, Uniting the United States.
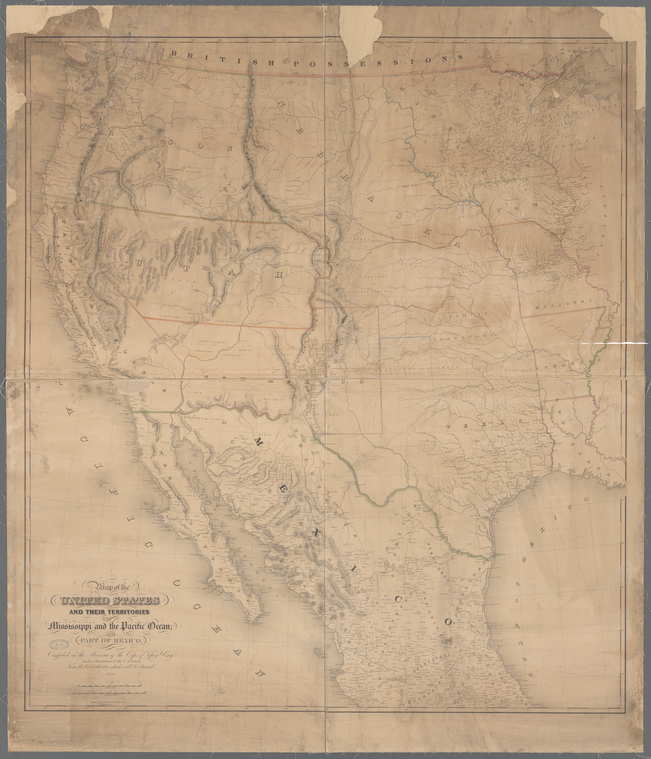
This 1850 U.S. Army Corps of Engineers map depicts the geography of the newly acquired United States territory in the Great Plains, Southwest, Pacific Northwest, Texas, and California; however, like most maps from this period in America’s history, it does not show the social or political situation that existed.
The 13 years between the end of the Mexican American War (February 1848) and the beginning of the Civil War (April 1861) was a tumultuous period during which five states were admitted to the Union: Wisconsin (May 1848), California (September 1850), Minnesota (May 1858), Oregon (February 1859), and Kansas (January 1861). With each newly admitted state, the young nation was faced with the defining moral question of the period: whether each state would be admitted as a slave state or free state.
Slave Population Maps
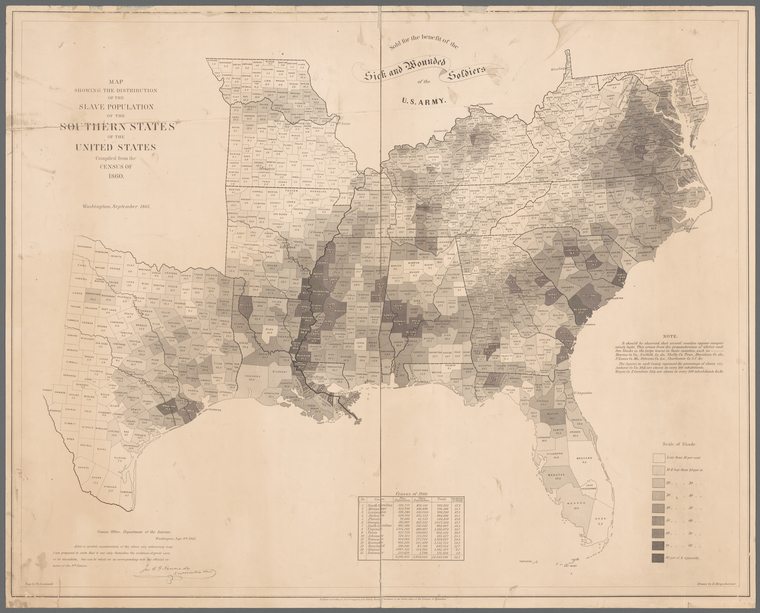
This map showing the distribution of the slave population of the southern states of the United States (1861) is a great example of a thematic map that attempted to confront the issue head-on.
This slave density map was created by German immigrant and U.S. Coastal Survey recruit Edwin Hergesheimer and commercial engraver Henry S. Graham. The duo also created a similar piece, Map of Virginia showing the distribution of its slave population from the census of 1860. In both works, the cartographer cleverly uses shading to depict demographic information gathered from the 1860 Census regarding the numbers of whites, free blacks, and enslaved persons recorded in all of the U.S. states in which slavery was permitted. As a result, we see a visual representation of the percentage of enslaved persons by county that existed on the eve of the Civil War.
Hergesheimer's 1861 map also includes a table with the total population of free and enslaved people by state, documenting the 3,950,343 women, men, and children recorded as being in bondage on U.S. soil. His choropleth map was ostensibly created and "sold for the benefit of the sick and wounded soldiers of the U.S. Army," yet its impact was far greater. A copy of the map appears in Francis Bicknell Carpenter’s portrait First Reading of the Emancipation Proclamation of President Lincoln (1864); in his memoir, the artist claims Lincoln would consult Hergesheimer’s map repeatedly during his six-month stay at the White House in 1864.
A few other maps related to U.S. slavery and the African American experience at NYPL:
- Map showing the distribution of slaves in the Southern States (186?)
- Underground routes to Canada (1898)
- Map showing the relation existing between slave labor and cotton production (1897)
- In motion: the African American migration experience (2005)
Civil War Maps: The Butterfield Collection
![[Battle of Fredericksburg] Dec. 13th Positions of Humphreys's [sic] Division [1862] / Butterfield Collection](https://images.nypl.org/index.php?id=5372759&t=w)
The Map Division was fortunate to receive a donation of 58 Civil War maps from the widow of Union Army general Daniel Butterfield (1831-1901). The collection includes print and manuscript maps created between 1861 and 1864, including several that were used in the field of battle.
Butterfield was born in Utica, N.Y., the son of John Butterfield, co-founder of Butterfield, Wasson and Co., which would later be known as the American Express Company. After graduating from Union College and working a few years in his father’s company, Daniel would volunteer as colonel of New York’s Twelfth Militia and served in the Union Army of the Potomac and the Army of the Cumberland, reaching the rank of major general.
After retiring from active duty, he became the assistant United States Treasurer in NYC and was awarded the Congressional Medal of Honor for his role in the Battle of Gaines’ Mill during which he was wounded.
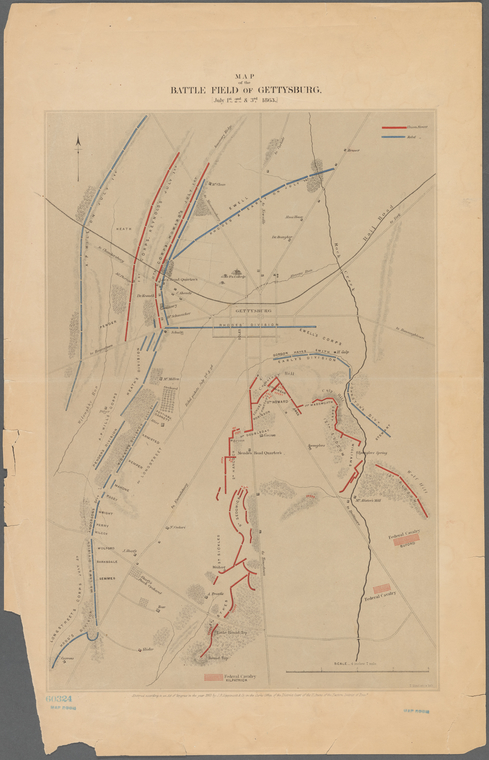
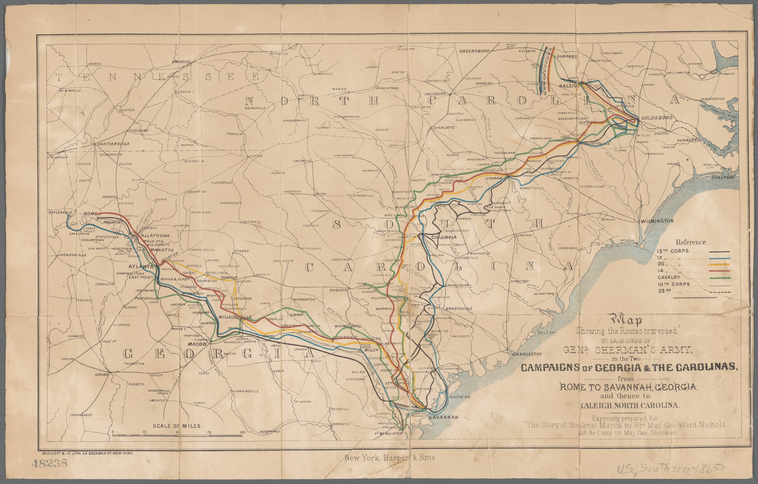
The maps in the Butterfield Collection offer just a few examples of the large number of maps and atlases which depict the "war between the states" or, as Union General William Tecumseh Sherman is quoted as saying, " [the] war is the remedy that our enemies have chosen, and I say let us give them all they want."
By the conclusion of the war in May 1865, the question of whether slavery would be permitted on U.S. territory had been decided; however the question of which groups would be encouraged and allowed to freely occupy the nation’s lands would remain unanswered.
The Western Expansion
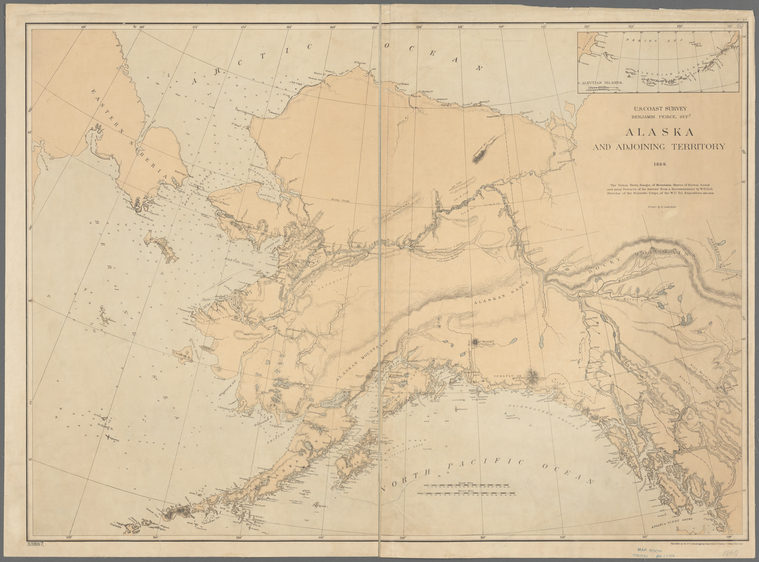
Less than two years later, the U.S. would increase its territorial size by almost 664,000 sq. miles (1,719,752 km2) with the purchase of Alaska for 7.2 million dollars from the Russian Empire in March 1867. Similar to the Louisiana, New Mexico, Oregon, and California territories acquired in the decades before, the region had been home to various peoples for millennia, but was sparsely populated. Like parts of the Southwest and Pacific Northwest, the area was also thought to contain significant quantities of gold and other mineral resources, in lands the government had declared to be in the public domain—eventually attracting large numbers of prospectors and settlers looking to make money or start a new life.
However, before settlers could come in large numbers, the territory and the surrounding waters of the north Pacific Ocean would need to be surveyed. During most of the the 19th century, the government entity responsible for mapping and charting the nation’s expanding coastline was the United States Coast Survey, today known as the U.S. Coast and Geodetic Survey.
![Precious metal regions of the public domain west of the 100° meridian (approximate) June 30, 1883 [1884] by Thomas Donaldson](https://images.nypl.org/index.php?id=57033148&t=w)
Yet, unlike in the Alaska Territory, migrants from the East Coast (and the European immigrants that followed them) who settled in the Great Plains, Rocky Mountain region, and West Coast during the latter half of the 19th century, moved across North America initially along wagon trails; after 1869, many more would travel via the newly built transcontinental railroads.
The federal government encouraged western settlements through the distribution of land grants to individuals, mining companies and, most important, to the railroads via the Pacific Railroad Act, which subsidized the construction of hundreds of miles of rail lines through the sale of the land surrounding the tracks.
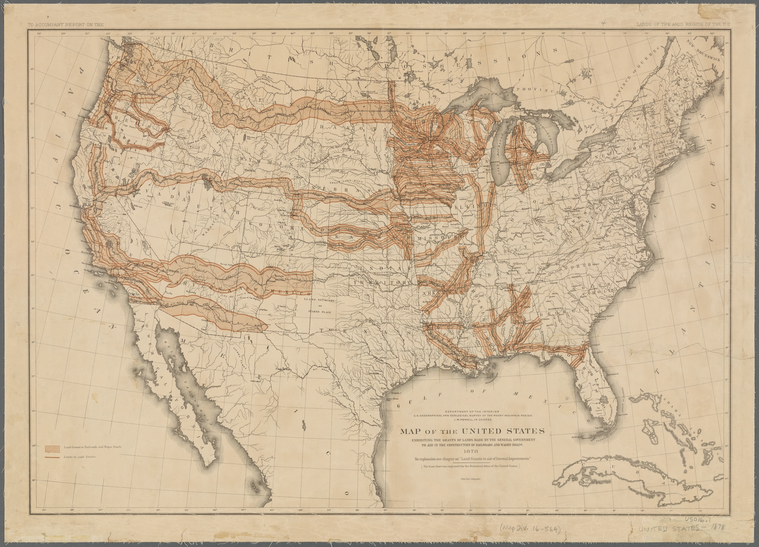
By the last decade of the 19th century, one could travel by train to almost every corner of the U.S. located south of the 49th parallel, on one of several dozen local and interstate railroads, and could also travel to large parts of southern Canada and Mexico.
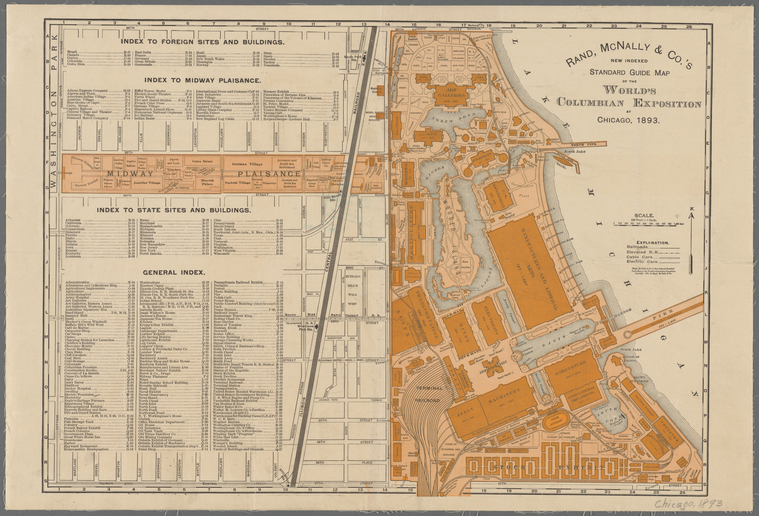
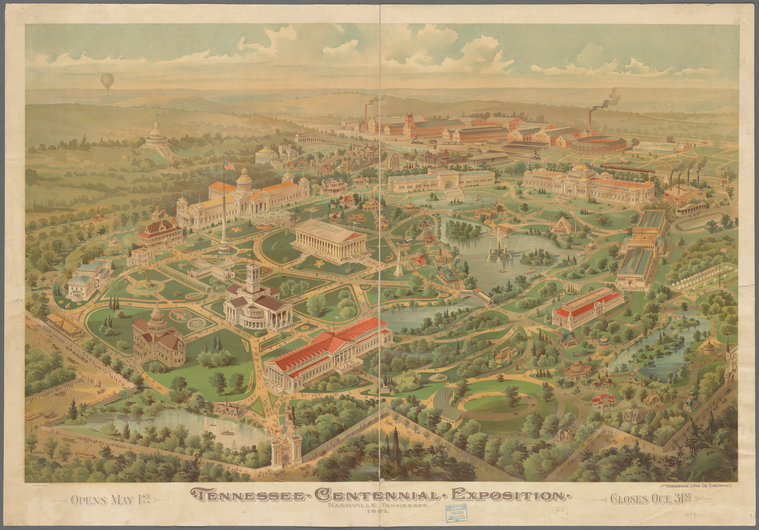
Due to the "Black exclusion laws," the Chinese Exclusion Act, and the general acceptance of white supremacy throughout the nation, waves of settlers were largely first, second, and third generation European immigrants. The increase in population was matched by the desire to enhance the nation’s agricultural and manufacturing capabilities, resulting in no fewer than 20 World’s Fairs, hosted by more than a dozen U.S. cities between 1876 and 1899.
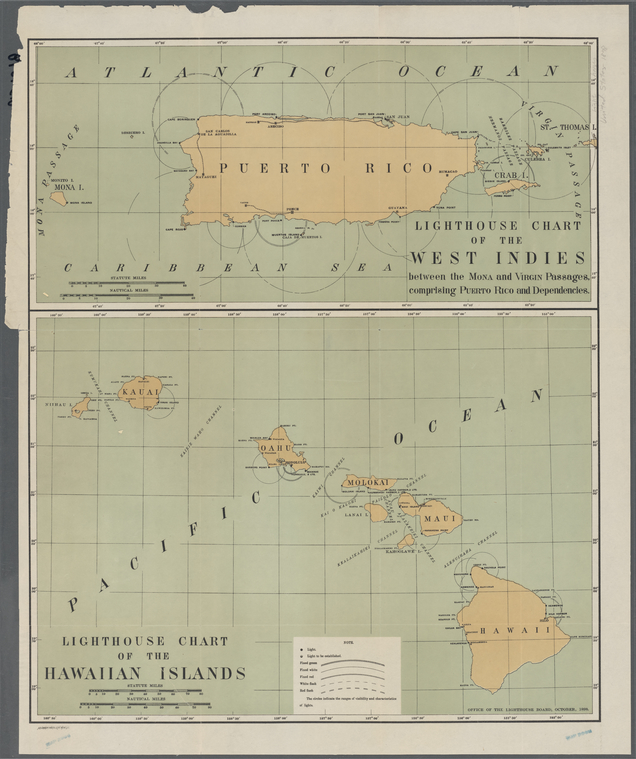
The nation’s appetite for territory and new markets would undergo one last push during the spring and summer of 1898, with the annexation of the sugar plantation Republic of Hawaii, and the acquisition of Puerto Rico and the Spanish East Indies at the conclusion of the Spanish-American War.
There was even a push by some to annex the island of Cuba. By the beginning of the 20th century, America the Beautiful spanned “from sea to shining sea” and beyond.
Read part one of the pre-1900 series, Uniting the United States.
Resources
American engravers upon copper and steel by Mantle Fielding
American maps and map makers of the Revolution by Peter J. Guthorn
British maps of the American Revolution by Peter J. Guthorn
The cartography of North America by Pierluigi Portinaro and Franko Knirsh
The mapping of North America: a list of printed maps, 1511-1670 by Philip D. Burden
The mapping of North America II: a list of printed maps 1671-1700 by Philip D. Burden
The mapping of North America: three centuries of map making 1500-1860 by John Goss
Maps and charts published in America before 1800 by James Clements WheatTooley’s dictionary of mapmakers edited by Josephine French
Washington Hood finding aid, Yale University
Read E-Books with SimplyE
 With your library card, it's easier than ever to choose from more than 300,000 e-books on SimplyE, The New York Public Library's free e-reader app. Gain access to digital resources for all ages, including e-books, audiobooks, databases, and more.
If you don’t have an NYPL library card, New York State residents can apply for a digital card online or through SimplyE (available on the App Store or Google Play).
Need more help? Read our guide to using SimplyE.