Mapping the Nation with pre-1900 U.S. Maps: Uniting the United States
NYPL’s pre-1900 U.S. map collection tells the story of America from its beginnings in the 17th century along the Atlantic coastline, to the consolidation of thirteen British colonies in the late 18th century, and concluding with its absorption of French, Spanish, and Mexican territories expanding westward from the Mississippi River tothe Pacific Ocean and beyond by the conclusion of the 19th century. Below is part one of our two-part series; you can read part two here, North vs South and Moving West.
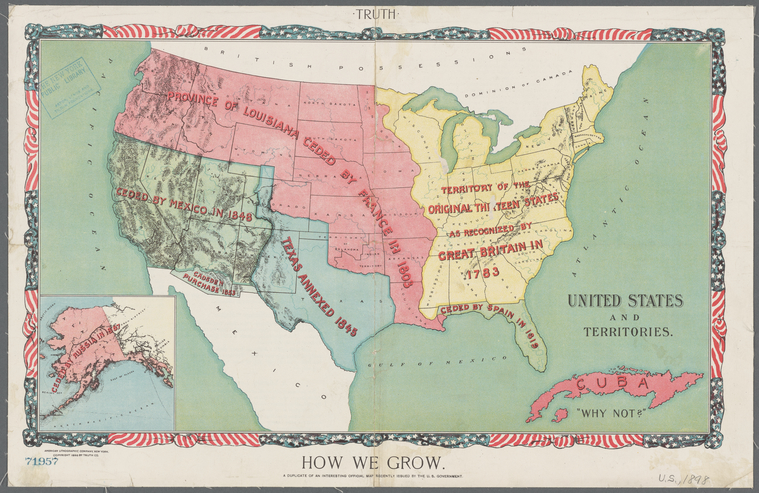
Over the past three years, with the help of an NEH grant, NYPL has produced online catalog records, created metadata, and provided essential preservation for, and digitally scanned, more than 3,000 antiquarian maps of the U.S. and North America, to make them available for online viewing and downloading to the public via the Digital Collections.
Although each of the 50 states is represented, it comes as no surprise that the pre-1900 U.S. collection is dominated by maps depicting the states and former colonies along the Atlantic seaboard, with state, county, and municipal maps of New York, Massachusetts, Pennsylvania, Virginia, and New Jersey accounting for the top five areas depicted.
The Northeast alone (from Maine to Washington, D.C.) makes up almost half of the collection, with the Southeast and Midwest totaling approximately 20% each. Maps showing the U.S. west of the Rocky Mountains account for a little less than 10% of the total, with maps of California comprising almost half of this region.
It is important to mention that the antiquarian U.S. maps catalogued, conserved, and scanned under this grant do not include the thousands of maps and charts in the Slaughter Collection and the John H. Levine Collection nor those in the library’s collection of historic atlases, many of which may also be viewed in the Digital Collections.
The following are some of highlights from the pre-1900 collection, which I believe help to illustrate the story of the geographical consolidation of our nation.
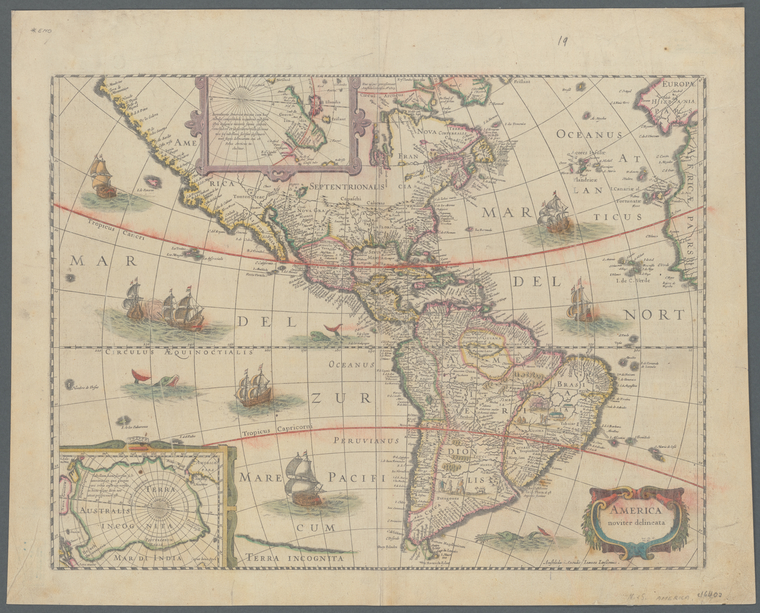
One of the oldest maps depicting North America in our collection is Jan Jansson’s 1641 masterpiece, "America Noviter Delineata." Jansson (1588-1664) was a Dutch mapmaker and publisher best known for the Atlas Novus world atlas, first published in 1638. The Library's copy of his 38 x 50 cm hand-colored map plate shows the new European colonies in North and South America as they existed in the first half of the 17th century, with two insets showing the North and South Pole.
The territory of modern-day U.S.A. contains areas claimed by the monarchies of Spain, France, England, and the Dutch Republic. Not surprisingly, the shape of the coastline isn’t very accurate and the interior of the North American continent is largely empty, primarily due to colonists' ignorance of the geography, and their inability or refusal to consult the numerous Native American nations inhabiting the interior. Some of the toponyms describing the coastal areas are familiar to us today, such as California, Florida, and Virginia. Jansson’s maps also include the approximate location and corrupted names of various Native American villages and pueblos as known to the newcomers.
![The isle of California, New Mexico, Louisiane, the river Misisipi, and the lakes of Canada [1701] / Herman Moll](https://images.nypl.org/index.php?id=5387011&t=w)
The Map Division includes no less than 75 maps and atlases created by prolific mapmaker Herman Moll (1654?-1732), whose exact origins are obscure, though it is assumed he was born in Germany or the Netherlands. We do know he produced a series of world atlases from his shop in London, the first of which was published in 1701 under the title A System of Geography.
Our copy of Moll's "The Isle of California, New Mexico, Louisiane, the river Misisipi, and the lakes of Canada," which may possibly come from one of his earlier atlases, is uncolored and has the number 36 handwritten in the upper right corner. As the title indicates, this map contains one of the most famous geographical errors in the history of cartography—the depiction of California as an island separate from the North American continent. This mistake was quite common in maps produced in the 16th, 17th and 18th centuries. (One Japanese map included the error as late as 1840.)
Moll’s map is relatively small, 16 x 18 cm (6 ⅓ x 7 inches), but it includes a great deal of information and shows the New Mexico and Louisiana colonies that occupied the western two-thirds of the continent. While the shape of North America appears wildly inaccurate, the general geography—the mountainous west, the Mississippi River feeding the "Bay of Mexico", and the location of the Great Lakes—for the most part, is correct. Moll also includes brief descriptions such as "Niagra Fort here is a great waterfall" and inscribed below the Rio Bravo del Norte (aka Rio Grande), "The people above this riv. are continually in wars with Spanyards", most likely in reference to the Pueblo Revolt in the late 1600s in the upper Rio Grande region of New Mexico. Also, note the phrase "Mission de Recolects, this is ye farthermost in ye whole country" in reference to the Recollects a French Reformed branch Order of the Friar Minor.
![Carte particulière de la Caroline [1696] by Nicolas Sanson](https://images.nypl.org/index.php?id=57373213&t=w)
Nicolas Sanson (1600-1667), a 17th century mapmaker known as the "father of French cartography", was also royal cartographer to both Louis XIII and Louis XIV. Although Sanson died in 1667, "Carte particuliere de la Caroline" most likely was a part of a collection of maps published by Covens & Mortier in 1700 in Atlas Nouveau.
This map depicts the South Carolina coast from just south of the Santee River to the Edisto River. Sanson's work shows the barrier islands, estuaries, and plantations surrounding the city of "Charles Town" at the end of the 17th century, only a few decades after the city was founded in 1670. Note the island labeled "Kayawak Indian Settlement"—perhaps this was the home of the Cusabo peoples native to the Carolina coast.
The island south of the town highlighted in yellow and labeled "Silivants" most likely depicts Sullivan's Island, which was the point of entry for large numbers of enslaved Africans brought to British North America.
![Carte contenant le royaume du Mexique et la Floride [1732] by Henri Chatelain](https://images.nypl.org/index.php?id=5476418&t=w)
Henri Abraham Chatelain (1684-1743) was a Huguenot born in Paris, but most likely living and working with his brother Zacharie (1690-1754) in Amsterdam at the time "Carte contenant le royaume du Mexique et la Floride" was produced. It appears in the second edition of the seven-volume Dutch encyclopedia Atlas Historic, written by Gueudeville and Garillon, for which the Chatelain brothers created map engravings.
Similar to Jansson’s map above, Chatelain’s work shows the large swaths of territory claimed by the European colonial powers but is drawn at a larger scale, allowing for greater detail. By the beginning of 18th century, the fledgling Dutch colonies that had existed between the Delaware and Connecticut Rivers had fallen under the influence of England, and are labeled "New Jersey" and "New York", connecting the southern colonies of Carolina, Virginia, and Maryland with the New England colonies along the coast to the north.
If we look closely, we can see changes along the lower Mississippi valley, now depicted as part of Spanish-controlled Florida. Nouvelle France had lost a large part of what would be known as the Louisiana territory, but Chatelain’s maps show the town of "Checagou" (Chicago) on the southwestern shore of "Lake Illinois", "le Detroit" (Detroit) at the northwestern edge of Lake Erie, and "Les Sioux", "Iroquois”, "Chaktas" (Choctaw Nation), and "Chicachas" (Chickasaw Nation).
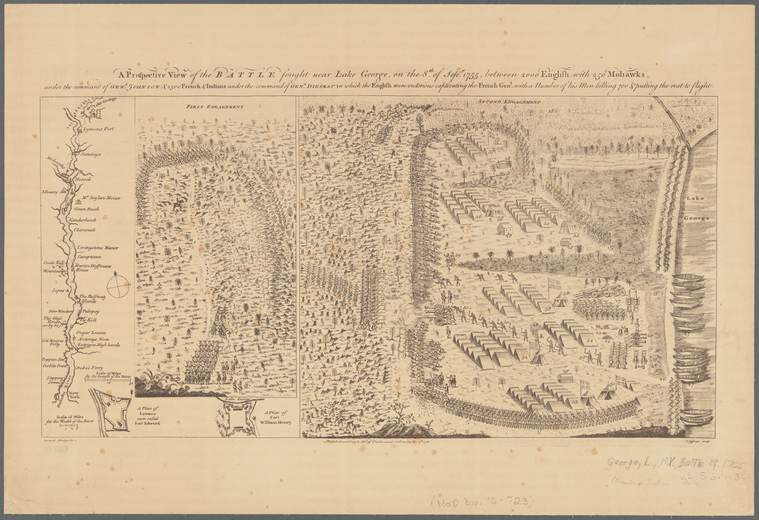
This aerial view, "A prospective view of the battle fought near Lake George…" is an early 19th century facsimile of a map that appears in Samuel Blodget’s (1724-1807) riveting recollection of the Battle of Lake George, one of the bloodiest battles to take place in the North American theater of the Seven Years’ War.
The often-forgotten war involved every major European power (and their colonies) of the 18th century, and included battles that took place on five continents between 1756 and 1763. Known as the French and Indian War (1754-1763) here in the States, due to the French and their indigenous allies acting as the principal enemies to the colonists of British North America, the battles occured at many forts that could be found along the murky boundary between New France and England’s North Atlantic colonies.
Blodget’s views depicts the various Native American nations, the British Army lead by General William Johnson, and the French army under the command of Baron Dieskau (who was captured at the end of the battle), the combatants in the first and second engagements of the Battle of Lake George, which took place between Fort Edward and Fort William Henry in northern New York State. To the left of the view, is a map of the forts and towns along the Hudson River between New York City and the battleground at Lake George. The original is available for viewing in the NYPL Rare Books Collection; you can read an electronic copy of the accompanying text, which describes the battle in detail.
![A new and accurate map of the present war in North America [1757] by John Hinton](https://images.nypl.org/index.php?id=5403998&t=w)
British bookseller and publisher John Hinton (-1781) created "A new and accurate map of the present war in North America", a color, 27 x 36 cm (10 ½ x 14 inches) map, two years after the Battle of Lake George; thus, it includes a depiction of Lake George near the center with adjacent labels "Gen. Johnson’s Camp" and "French Camp."
His map helps us understand what the North America battles of the Seven Years’ War were really about—control of people, resources, and land. In the mid-18th century, boundaries between colonies and tribal lands were in flux, usually based on the ability of a group to control an area through force or, more often than not, by direct occupation. Maps were a manifestation of this desire to claim and control the natural resources (beaver pelts, fresh water, arable land) and helped to codify territorial domination. Like most maps of colonial North America, Hinton’s work exemplifies this idea through the use of color, depiction of physical features, and toponyms, but without the use of solid boundary lines. We see the names of forts, Indian territories, and colonies—intertwined and overlapping—with each fighting to control the imagined space on his map plate.
![A new map of the Cherokee Nation [1760] by Thomas Kitchin](https://images.nypl.org/index.php?id=5387010&t=w)
Like Hinton, Thomas Kitchin (1718-1784) was another 18th century cartographer based in London, whose works can be found throughout the Library’s collection of maps of early America. His engraving "A new map of the Cherokee Nation" shows the territory controlled by the Cherokees in what is now eastern Tennessee, northern Georgia, and the western edge of Virginia and the Carolinas. It appeared as an illustration in the February 1760 edition of the curiously titled journal London Magazine, or, the Gentleman’s monthly intelligencer.
Although the Cherokee’s ancestral land was located a few hundred miles south of the ongoing skirmishes within the Appalachian region of the Northeast, the strategic importance of their land (and the reason it was of concern to 18th century English gentlemen) can be seen in the note at the lower left of Kitchin’s map, describing an observation made by a British Army colonel concerning the possibility of French troops using rivers within the territory to supply materials from the west to their allies in the towns closer to the battles. At first glance, the map may seem confusing due to his description of what is now known as the Tennessee River as the "Mifsifsipi River"; however the Tennessee does, in fact, feed into the Mississippi after connecting with the Ohio River 652 miles (1,049 km) to the west. This river and the state that bears its name are derived from the former territorial capital Tanasi or "Tunnasee", as it is labeled at the upper-left corner of the map.
![Distribution of his majesty's forces in N. America according to the disposition now and to be completed as soon as practicable [1766] by Daniel Paterson](https://images.nypl.org/index.php?id=5437643&t=w)
The Cherokees’ ancestral land, like all other Native lands along the Atlantic coast of North America at this time, was increasingly coveted by the British crown and her colonial settlers, who moved steadily westward from the coastal plain over the Appalachians, into the woodlands and savannas east of the Mississippi. This was especially true at the conclusion of the French & Indian War and is exemplified in "Distribution of his Majesty's forces in N. America…", a pen-and-ink watercolor manuscript map by cartographer and Assistant Second Major General Daniel Paterson (1738-1825). It shows movement of British detachments from larger regiments and companies in Spring 1766, three years after the Treaty of Paris (1763), which ceded French Canada to Britain and control over East Louisiana (New France east of the Mississippi). France's territory west of the Mississippi was ceded to Spain in return for its loss of West Florida and East Florida to Britain.
Note the depiction of large regiments of British soldiers stationed throughout newly acquired forts of Mobile, Pensacola, Detroit, and Quebec City, as well as movements of companies from Quebec to forts throughout South Carolina. Equally important is the large label "Lands reserved for the Indians", which covers most of the land west of the Appalachian Mountains and east of the Mississippi, from the Florida Panhandle up north into modern day Quebec.
Paterson’s map depicts the territorial expansion of the Atlantic coast colonies into the continent onto the eastern shores of the Mississippi, however the inclusion of this note over the newly acquired lands reinforced King George III's Royal Proclamation of 1763 forbiding all settlement west of a line drawn along the Appalachians.
![Boston and the adjacent country with the stations of the British & provincial armies [1775]](https://images.nypl.org/index.php?id=57181433&t=w)
We are all familiar with the phrase "history is written by the victors"; in the world of antiquarian maps, its truth is certainly questionable. Case in point: The Library’s collection of American Revolutionary War battle maps, which where almost all created in London (with a few exceptions like the 1777 map made by Gabriel Nicolaus Raspe in Nuremberg and this 1781 map made by Charles Picquet in Paris.) Although there were several American cartographers who produced maps depicting the various military engagements of the War for Independence (see American Maps and Map Makers of the Revolution) few of their original maps may be found in the Library’s holdings (Bernard Roman's 1775 Map of the seat of Civil War in America is a notable exception.)
Fortunately, we can still gain an appreciation for the events of the war using the works created by the "losing side" such as this 1775 engraving titled "Boston and the adjacent country with the stations of the British and provincial armies" for Benjamin Martin’s General Magazine of Arts and Sciences. Although measuring a mere 18 x 23 cm (7 x 9 inches), the map provides ample information on the fortifications and troop location in the vicinity of Boston, during the Battle of Bunker Hill, June 17, 1775.
![Plan of the siege of York Town in Virginia [1787] by William Faden](https://images.nypl.org/index.php?id=57377885&t=w)
![A plan of the attack of Fort Sulivan, near Charles Town in South Carolina [1776] by William Faden](https://images.nypl.org/index.php?id=57282207&t=w)
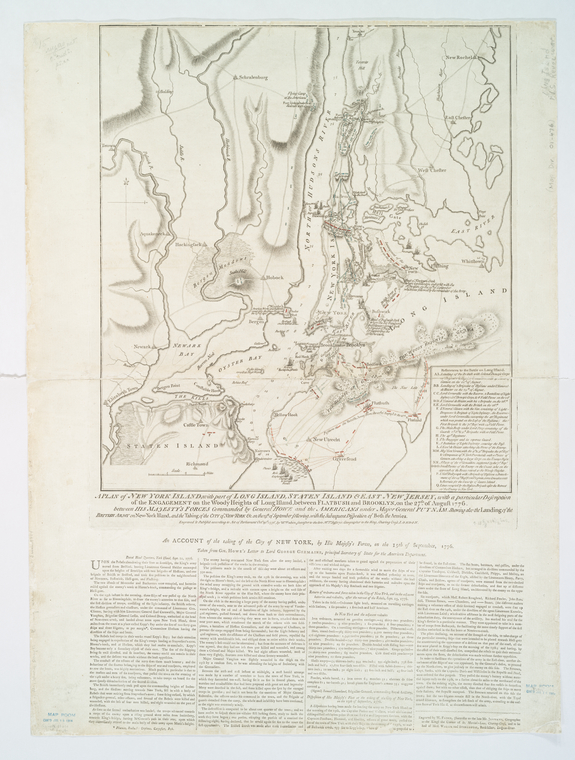
One of the best-known British cartographers who depicted America’s battle for independence was royal geographer William Faden (1749-1836). Born the son of a London printer, Faden would complete an engraver apprenticeship in 1771 and would go on to publish, engrave, and create scores of maps and atlases of Europe and North America, including Bernard Ratzer’s "Plan of the City of New York" (1776) and one of the most authoritative books to document the war, The North American Atlas (in 1776, 1777, and 1778).
The atlas includes 23 hand-colored maps of the various military skirmishes between the "rebels", the French, and the British armies that occurred throughout the conflict. He would go on to produce multiple versions showing the Battle of Sullivan’s Island, the Battle of Brooklyn, and the Siege of York Town.
![The United States according to the definitive treaty of peace signed at Paris, Septr. 3d, 1783 [1784] by William McMurray](https://images.nypl.org/index.php?id=5312798&t=w)
The war would officially end on September 3, 1783 at the signing of the Treaty of Paris. Six months later, a little-known goldsmith (and convicted counterfeiter) from Connecticut named Abel Buell would publish his now famous "A New and Correct Map of the United States of North America Layd Down from the Latest Observations and Best Authorities Agreeable to the Peace of 1783", the first map to be copyrighted in the newly formed United States of America.
For many years, historians believed William McMurray’s "The united States according to the definitive treaty of peace signed at Paris Septr. 3d, 1783" to be the first, but his map was published in December of 1784, a full eight months after Buell’s. McMurray, a captain of the 10th Pennsylvania Regiment who served as U.S. Assistant Geographer, was much better-connected to the young country’s centers of power and, as a result, his map not only depicts the state boundaries as they existed but also includes the proposed boundaries of the forthcoming states between the Ohio and Mississippi River, planned by Congress in April 1784, in what was then referred to as the Northwest Territory.
Before the state lines within this vast area that included several of the Great Lakes could be finalized, this territory would first need to be mapped and surveyed. The work of Philadelphia geographer, draftsman, and publisher Samuel Lewis (1753 or 1754 -1822) certainly played a role in the public’s understanding of this region, and the states that formed the original 13 colonies. Lewis would also publish maps of the Louisiana territory with information gathered by the two-year journey of William Clark and Meriwether Lewis (no relation). His "map of part of the N.W. Territory of the United States" was created in 1796, four years before Ohio, the first state formed from part of the territory, was admitted to the Union. As the subtitle states, it is compiled from "actual surveys and the best information", showing the location of natural features, military forts, and the area land grants that would soon become part of the state.
![A map of part of the N. W. Territory of the United States [1796] by Samuel Lewis](https://images.nypl.org/index.php?id=5452686&t=w)
Lewis’ map also depicts a line labeled "Indian boundary line agreeably to Treaty at Greenville 1795…", a reference to the treaty signed between representatives from several local Native American tribes and the U.S. government, establishing a boundary between land open to settlers and land reserved for use by Native peoples.
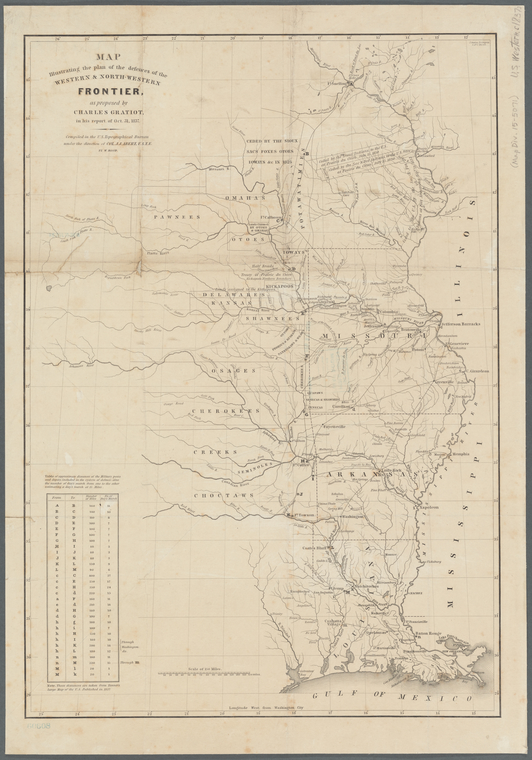
Needless to say, this line didn’t hold for very long as U.S. migrants from the east slowly pushed westward into what is now the Midwest. The call to push indigenous peoples from western lands would continue for the duration of the 19th century; however, the desire to exploit Native lands would also include peoples who had historicaly occupied areas in the American South under the Indian Removal Act of 1830. The forced relocation of the southeastern tribes (including the Cherokees, Choctaws, Chickasaws, Seminoles, and Creeks) and the nations aboriginal to the Midwest (including Sac and Fox, Shawnees, and Kickapoos) into areas that would eventually be officially known as Indian Territory (lands that were traditionaly inhabited by the Osages, Kiowa, and Kansa peoples) was created under the Indian Intercourse Act of 1834.
All of this is captured in cartographer Washington Hood’s "Map illustrating the plan of the defences of the western & north-western frontier" (1837), which he created to accompany a Senate report by Charles Gratiot in October 31, 1837. Like Lewis, Hood (1808-1840) was a Philadelphian; unlike the elder mapmaker, Lewis created maps largely based on survey work he himself had participated in as a member of the U.S. Army Corps of Engineers and the Corps of Topographical Engineers. Hood would die a year after falling ill from an 1839 expedition in the northeastern region of what would later become Oklahoma.
It's not surprising that maps created by the Army Corps of Engineers (USACE) and Corps of Topographical Engineers comprise a significant portion of the NYPL U.S. map collection. The former organization was created in March 1802 by Thomas Jefferson; the latter was formed in July 1838 under President Martin Van Buren.
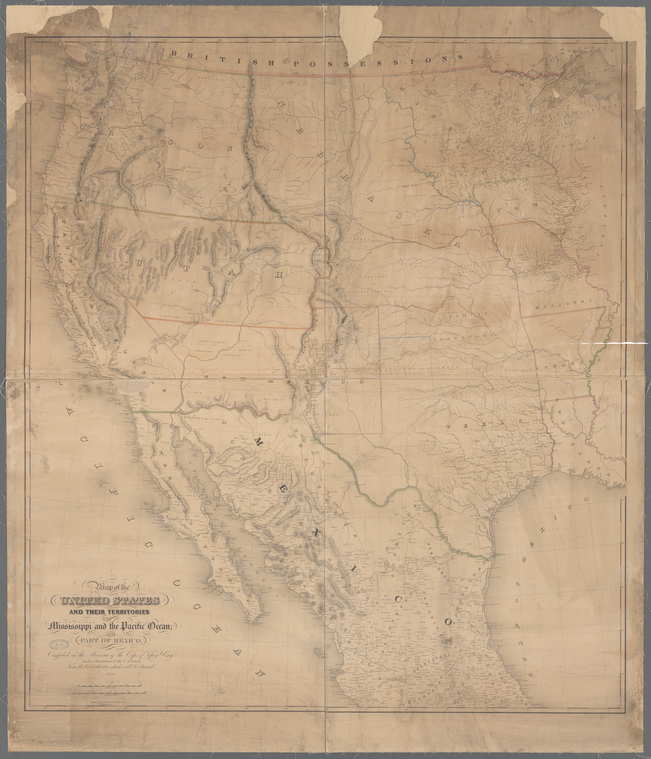
Although initially acting as two distinct organizations (merging together as the USACE in March of 1863), both played crucial roles in surveying and mapping the various French, British, Mexican, and Native American territories bought, annexed, and ceded to the U.S. government between the Mississippi River and the Pacific Coast, throughout the 19th century.
A good example of the Corps' work can be seen in "Map of the United States and their territories between the Mississippi and the Pacific Ocean and part of Mexico" (1850), a large, 110 x 97 cm (43 x 38 inches) map engraved by Sherman & Smith, most likely at their NYC office that was located at 135 Broadway.
Read part two of our pre-1900 map series, North vs South and Moving West.
Read E-Books with SimplyE
 With your library card, it's easier than ever to choose from more than 300,000 e-books on SimplyE, The New York Public Library's free e-reader app. Gain access to digital resources for all ages, including e-books, audiobooks, databases, and more.
If you don’t have an NYPL library card, New York State residents can apply for a digital card online or through SimplyE (available on the App Store or Google Play).
Need more help? Read our guide to using SimplyE.
